Configure Livenesss Probe
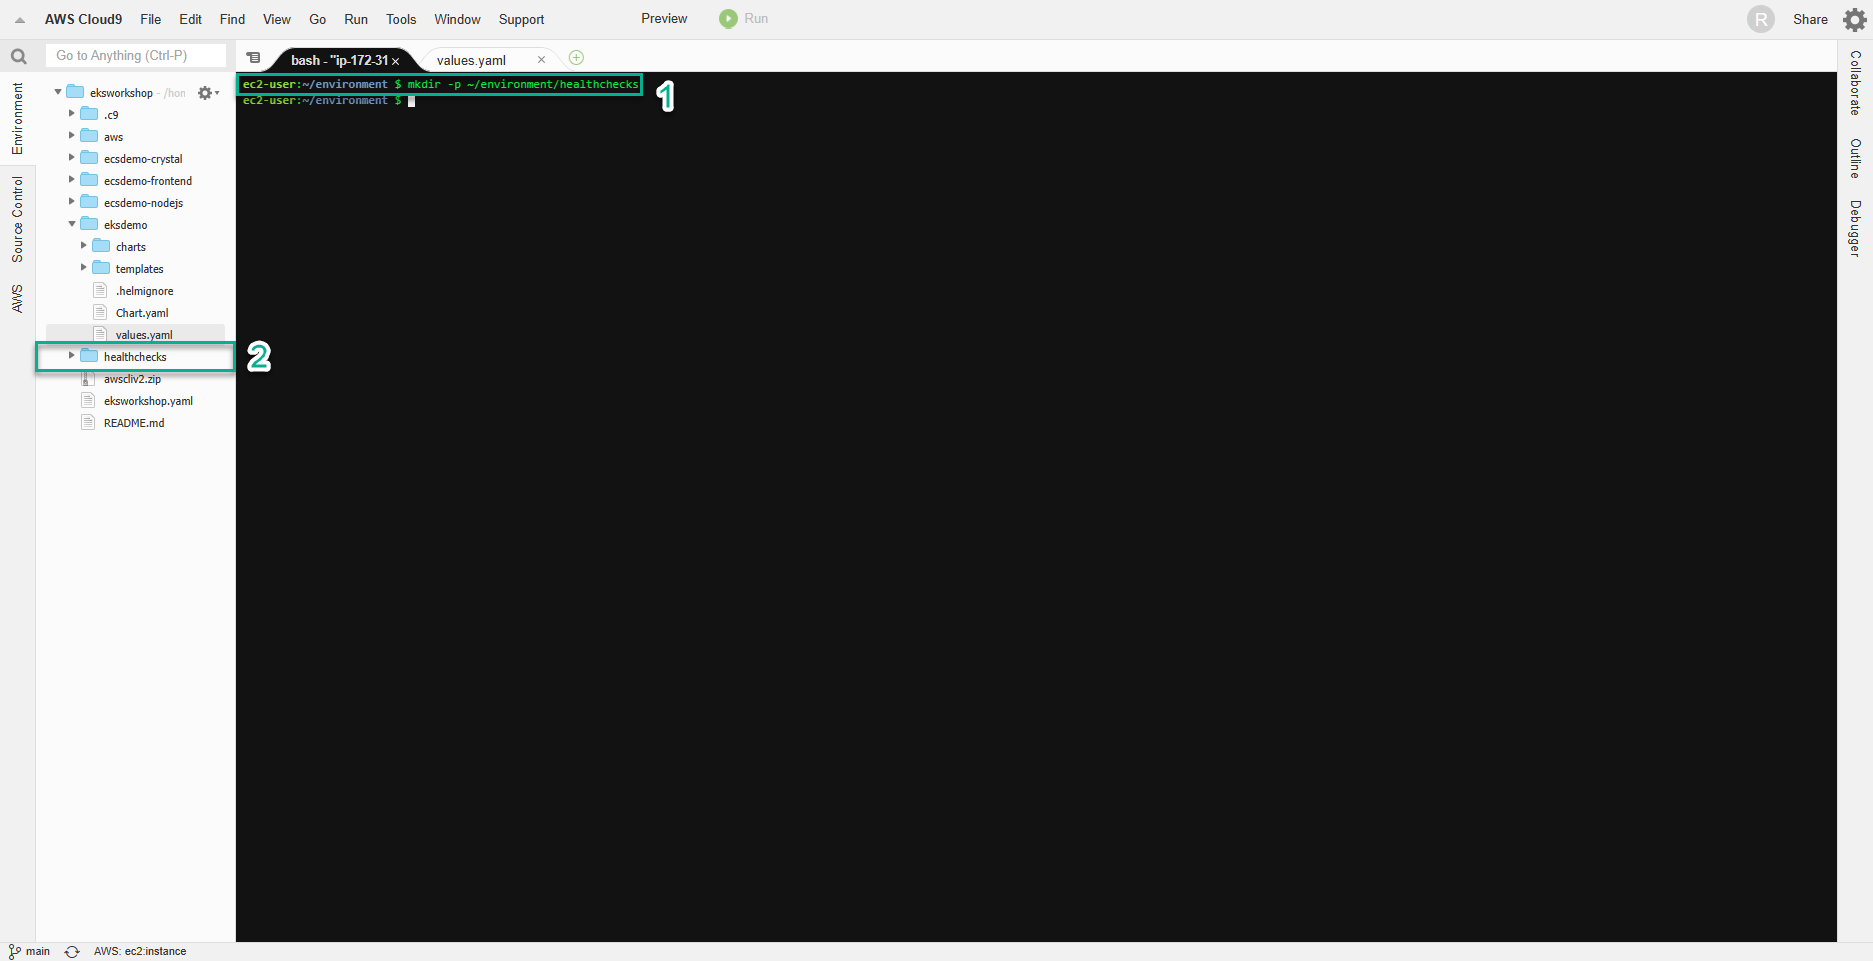
Configure the Probe Use the command below to create a directory
mkdir -p ~/environment/healthchecks
Run the following code block to populate the manifest file ~/environment/healthchecks/liveness-app.yaml. In the configuration file, the livenessProbe field determines how kubelet should check the container in order to consider whether it is healthy or not. kubelet uses the periodSeconds field to do frequent check on the Container. In this case, kubelet checks the liveness probe every 5 seconds. The initialDelaySeconds field is used to tell kubelet that it should wait for 5 seconds before doing the first probe. To perform a probe, kubelet sends a HTTP GET request to the server hosting this pod and if the handler for the servers /health returns a success code, then the container is considered healthy. If the handler returns a failure code, the kubelet kills the container and restarts it.
cat <<EoF > ~/environment/healthchecks/liveness-app.yaml
apiVersion: v1
kind: Pod
metadata:
  name: liveness-app
spec:
  containers:
  - name: liveness
    image: brentley/ecsdemo-nodejs
    livenessProbe:
      httpGet:
        path: /health
        port: 3000
      initialDelaySeconds: 5
      periodSeconds: 5
EoF

Let’s create the pod using the manifest:
kubectl apply -f ~/environment/healthchecks/liveness-app.yaml

The above command creates a pod with liveness probe.
kubectl get pod liveness-app

The output looks like below. Notice the RESTARTS
NAME           READY     STATUS    RESTARTS   AGE
liveness-app   1/1       Running   0          11s
The kubectl describe command will show an event history which will show any probe failures or restarts.
kubectl describe pod liveness-app
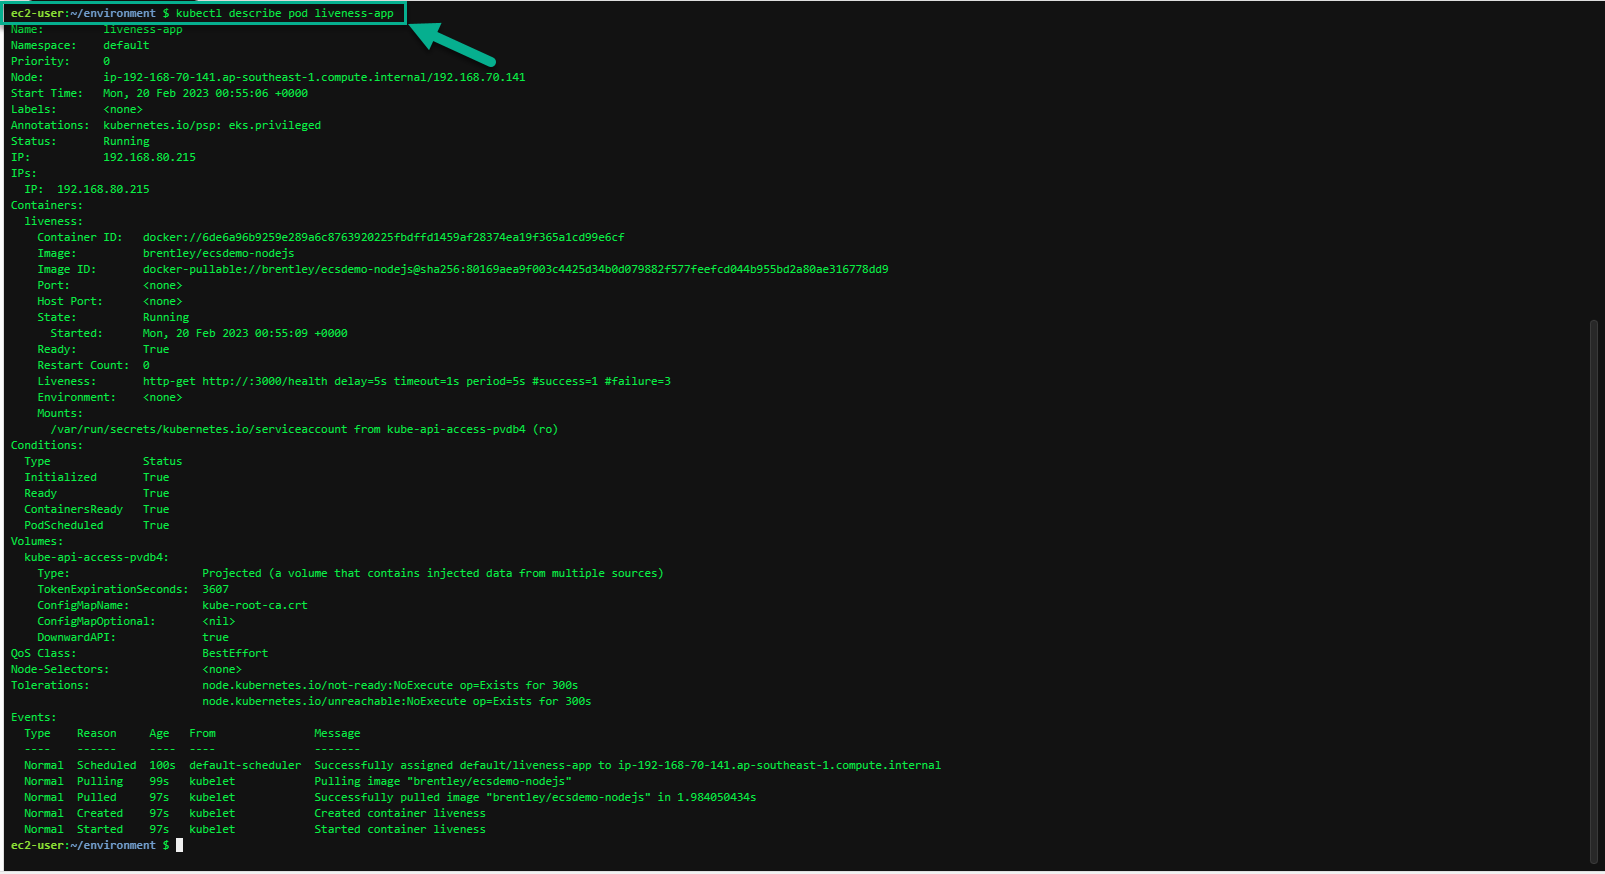
Events:
  Type    Reason                 Age   From                                    Message
  ----    ------                 ----  ----                                    -------
  Normal  Scheduled              38s   default-scheduler                       Successfully assigned default/liveness-app to ip-192-168-18-63.ec2.internal
  Normal  Pulling                37s   kubelet                                 Pulling image "brentley/ecsdemo-nodejs"
  Normal  Pulled                 37s   kubelet                                 Successfully pulled image "brentley/ecsdemo-nodejs" in 108.556215ms
  Normal  Created                37s   kubelet                                 Created container liveness
  Normal  Started                37s   kubelet                                 Started container liveness
Introduce a Failure
We will run the next command to send a SIGUSR1 signal to the nodejs application. By issuing this command we will send a kill signal to the application process in the docker runtime.
kubectl exec -it liveness-app -- /bin/kill -s SIGUSR1 1
Describe the pod after waiting for 15-20 seconds and you will notice the kubelet actions of killing the container and restarting it.
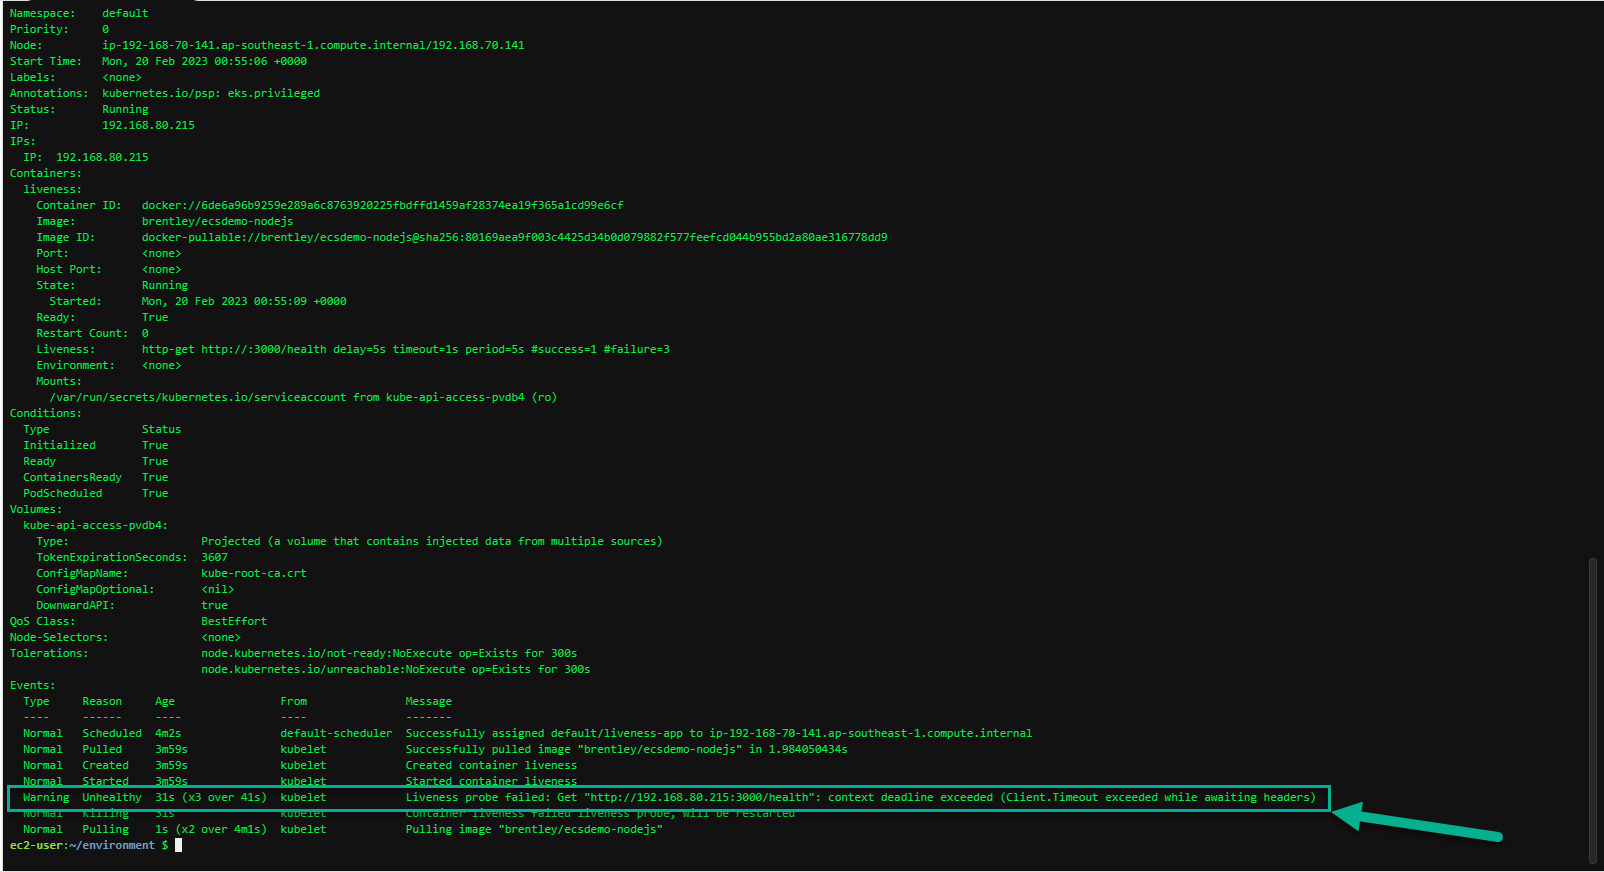
Events:
  Type     Reason         Age                From                  Message
  ----     ------         ----               ----                  -------
  Normal   Scheduled      72s                default-scheduler     Successfully assigned default/liveness-app to ip-192-168-18-63.ec2.internal
  Normal   Pulled         71s                kubelet               Successfully pulled image "brentley/ecsdemo-nodejs" in 100.615806ms
  Warning  Unhealthy      37s (x3 over 47s)  kubelet               Liveness probe failed: Get http://192.168.13.176:3000/health: context deadline exceeded (Client.Timeout exceeded while awaiting headers)
  Normal   Killing        37s                kubelet               Container liveness failed liveness probe, will be restarted
  Normal   Pulling        6s (x2 over 71s)   kubelet               Pulling image "brentley/ecsdemo-nodejs"
  Normal   Created        6s (x2 over 71s)   kubelet               Created container liveness
  Normal   Started        6s (x2 over 71s)   kubelet               Started container liveness
  Normal   Pulled         6s                 kubelet               Successfully pulled image "brentley/ecsdemo-nodejs" in 118.19123ms
When the nodejs application entered a debug mode with SIGUSR1 signal, it did not respond to the health check pings and kubelet killed the container. The container was subject to the default restart policy.
kubectl get pod liveness-app
The output looks like below:
NAME           READY     STATUS    RESTARTS   AGE
liveness-app   1/1       Running   1          12m
How can we check the status of the container health checks?
kubectl logs liveness-app
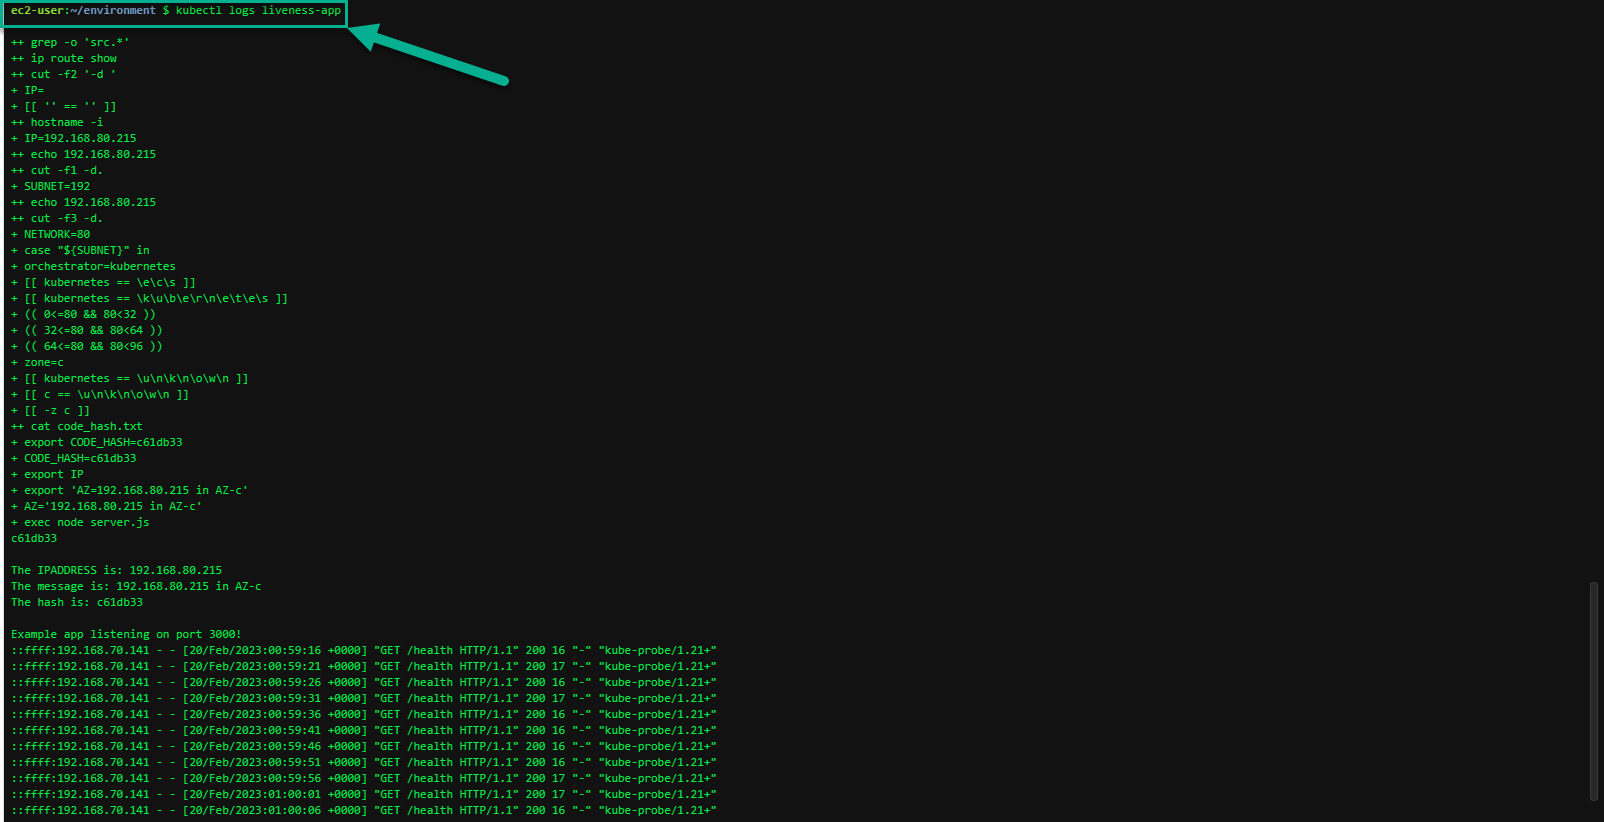
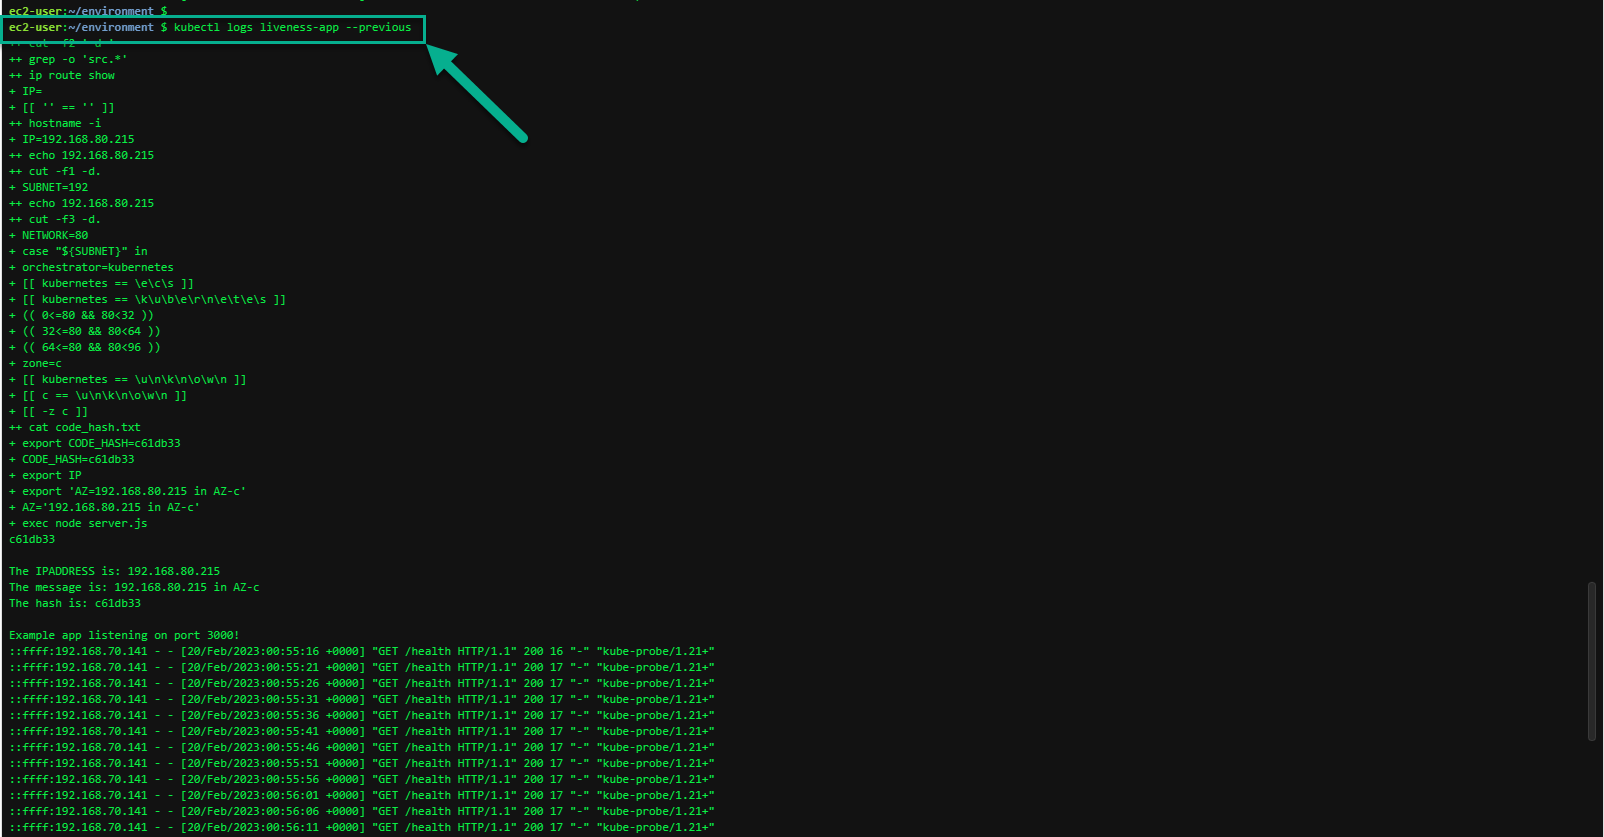
You can also use kubectl logs to retrieve logs from a previous instantiation of a container with --previous flag, in case the container has crashed
kubectl logs liveness-app --previous
